Introduction to Statistical Misinterpretation
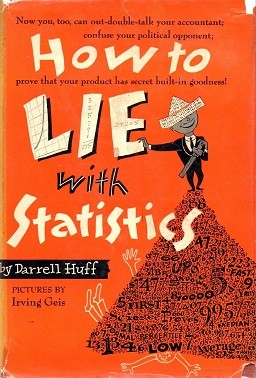
In “How to Lie with Statistics,” Darrell Huff presents a timeless exploration of how statistics can be manipulated to mislead audiences. Despite being published decades ago, the book’s insights remain relevant, especially in today’s data-driven world. Huff’s work serves as a guide for professionals to navigate the complexities of statistical data, ensuring they can discern truth from manipulation. This summary distills the book’s core themes, offering strategic insights for professionals seeking to leverage data ethically and effectively.
The Art of Deceptive Data Presentation
Understanding the Basics of Statistical Manipulation
At the heart of Huff’s book is the concept that statistics, while seemingly objective, can be easily manipulated. This manipulation often begins with the presentation of data. Huff explains that graphs, charts, and figures can be designed to emphasize certain aspects while downplaying others. For instance, altering the scale of a graph can exaggerate or minimize differences in data, leading to misleading interpretations. Professionals must be vigilant, questioning not just the data itself, but how it is presented.
Consider the analogy of a photographer who can make a small room appear spacious by using a wide-angle lens. Similarly, a presenter can make minor data differences seem significant by adjusting the graph’s scale, misleading stakeholders. This idea is echoed in Edward Tufte’s “The Visual Display of Quantitative Information,” where he stresses the ethical responsibility of data visualization.
The Power of Context and Framing
Huff emphasizes the importance of context in interpreting statistics. Numbers without context can be misleading. For example, a percentage increase in sales might seem impressive until you realize it’s from a very low base. Professionals should always seek the full story behind the numbers, considering external factors that might influence statistical outcomes. This approach aligns with modern business strategies that prioritize holistic analysis over isolated data points.
A vivid example might involve the reporting of health statistics. A 50% increase in a particular disease sounds alarming, but if the initial number of cases was two and it increased to three, the context changes the perception entirely. This understanding is crucial in fields like public health and economics, where data-driven decisions have significant real-world impacts.
Recognizing Common Statistical Fallacies
1. Correlation vs. Causation
One of the most critical lessons from Huff’s work is the distinction between correlation and causation. Just because two variables move together does not mean one causes the other. This fallacy is prevalent in business and policy-making, where assumptions about causality can lead to misguided strategies. Huff’s insights encourage professionals to dig deeper, employing rigorous analysis to establish causal relationships.
For instance, while ice cream sales and drowning incidents both increase during the summer, one does not cause the other. This is a classic example of correlation without causation, a concept further explored in Nassim Nicholas Taleb’s “Fooled by Randomness,” which discusses the unpredictability of events and the dangers of assuming causation from correlation.
2. The Misuse of Averages
Averages are another area ripe for manipulation. Huff illustrates how averages can hide significant variations within data sets. For instance, a high average income in a region might mask the fact that most people earn far less, with a few high earners skewing the data. Professionals should consider alternative measures, such as medians or modes, to gain a more accurate picture.
In the book “The Signal and the Noise” by Nate Silver, the importance of understanding data distributions is emphasized. Silver highlights that relying solely on averages can obscure critical insights necessary for effective prediction and decision-making.
3. Sample Bias
Sample bias occurs when the sample used in a study does not accurately represent the population it’s meant to. This can lead to skewed data and false conclusions. Huff warns against this common pitfall, emphasizing the need for random sampling methods to ensure validity and reliability.
A contemporary example is in political polling, where the sampling of only certain demographics can lead to inaccurate predictions, as seen in several recent elections. The importance of diverse and representative sampling is a theme also explored in “Freakonomics” by Steven Levitt and Stephen Dubner, which discusses unconventional explanations for economic phenomena.
4. Misleading Graphs
Graphs are powerful tools for data visualization, but they can be misleading if not used carefully. Huff discusses how truncating axes or using non-uniform intervals can distort perceptions. Professionals must ensure that visual representations of data are clear and honest.
This concept is further validated in “Factfulness” by Hans Rosling, where the author advocates for clear and truthful presentation of data to combat misconceptions about global trends.
5. Questionable Cause and Effect
Huff highlights the dangers of assuming a cause-and-effect relationship without sufficient evidence. This fallacy can lead to misguided strategies and decisions. Professionals are encouraged to use controlled experiments and longitudinal studies to establish causation.
This idea resonates with Daniel Kahneman’s “Thinking, Fast and Slow,” where he explores how cognitive biases can lead individuals to make erroneous causal inferences.
Strategic Frameworks for Ethical Data Use
Building a Culture of Data Literacy
Huff’s work underscores the need for a culture of data literacy within organizations. Professionals must be equipped to critically evaluate statistical claims, fostering an environment where data is used responsibly. This involves training teams to understand statistical principles and encouraging a questioning mindset. Organizations can draw parallels with modern frameworks like data governance and ethics in AI, ensuring data-driven decisions are both effective and ethical.
To cultivate this culture, leaders can implement regular training sessions, workshops, and seminars focused on statistical literacy. Encouraging employees to question and verify data before making decisions can prevent costly mistakes and enhance decision-making processes. This aligns with the principles discussed in “Data-Driven” by DJ Patil, which emphasizes the importance of a data-savvy workforce in achieving strategic goals.
Leveraging Data for Strategic Advantage
While Huff highlights the potential for data misuse, he also acknowledges its power when used correctly. Professionals can harness data to drive strategic initiatives, provided they maintain a commitment to accuracy and transparency. This involves integrating data insights into decision-making processes, aligning with contemporary practices in digital transformation and agile methodologies.
By employing data analytics tools and techniques, organizations can gain a competitive edge, optimize operations, and innovate. However, as emphasized in “Competing on Analytics” by Thomas H. Davenport, maintaining integrity and transparency in data practices is crucial for long-term success.
Modern Applications and Comparisons
Data in the Age of AI and Digital Transformation
In today’s digital age, the volume and complexity of data have increased exponentially. Huff’s principles are more relevant than ever, as AI and machine learning algorithms often rely on vast datasets. Professionals must ensure these technologies are trained on accurate, representative data to avoid perpetuating biases and inaccuracies. Huff’s call for skepticism and critical thinking is echoed in current discussions around AI ethics and digital responsibility.
For example, biased algorithms in AI can lead to unfair outcomes, such as in hiring processes or loan approvals. Ensuring that AI models are trained on unbiased and comprehensive datasets is essential, a sentiment reinforced by Cathy O’Neil in “Weapons of Math Destruction,” where she warns of the dangers of big data algorithms when used irresponsibly.
Drawing Parallels with Other Notable Works
Huff’s insights can be compared to other seminal works in the field of data and decision-making. For instance, Daniel Kahneman’s “Thinking, Fast and Slow” explores cognitive biases that affect decision-making, complementing Huff’s focus on statistical manipulation. Similarly, “Nudge” by Richard Thaler and Cass Sunstein examines how subtle changes in choice architecture can influence behavior, paralleling Huff’s exploration of data presentation.
Both works emphasize the importance of understanding human cognitive processes and the potential for data to influence decisions subtly. By integrating these insights, professionals can better anticipate and mitigate the effects of biases and manipulations in their data-driven strategies.
Final Reflection
“How to Lie with Statistics” remains a crucial resource for professionals navigating the complexities of data in the modern world. Huff’s insights encourage a critical, ethical approach to data use, emphasizing the importance of transparency and accuracy. By adopting these principles, professionals can harness the power of data to drive informed, effective strategies while safeguarding against manipulation and misinformation.
In an era where data is more influential than ever, Huff’s work provides a foundation for responsible data-driven decision-making. Across domains such as leadership, design, and change management, the principles of statistical literacy and ethical data use are paramount. Just as leaders must inspire trust and transparency, data practitioners must ensure the integrity of the insights they provide.
Furthermore, as organizations increasingly rely on data to guide strategic decisions, understanding the nuances of statistical manipulation and presentation is vital. By synthesizing insights from Huff’s work with those from complementary texts, professionals can cultivate a robust framework for ethical data practices that stands the test of time. Through continuous learning and application of these principles, the potential for data to drive positive change and innovation is limitless.

